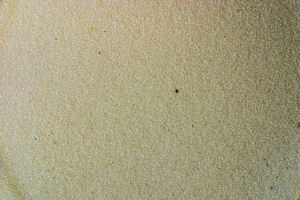

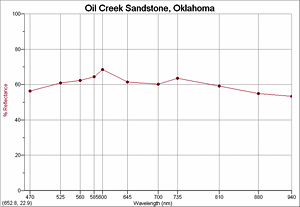
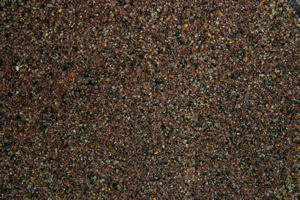

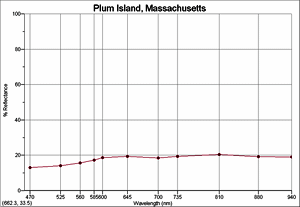





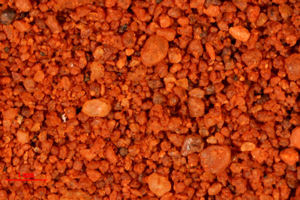

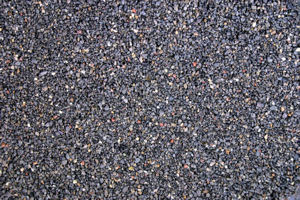


I just finished a course in lunar geology through Montana State University, and was introduced to the ALTA II Reflectance Spectrometer. We used it to measure the surface reflection of three of the most common lunar samples. I was hooked! I immediately saw what I thought would be a great addition to each sand sample. Arizona State University has a similar activiy with their Rock Around the World project. It began with the successful landing of MER's Opportunity, and Spirit on Mars many years ago, and is still going on. Students from around the world send cleaned rock samples to ASU, and the lab there photographs the sample and posts an emission spectrum of the sample. Why not do this for sand?
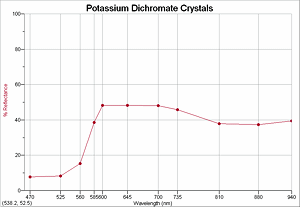
A reflectance spectrum is a graph of the amount of light being reflected from a sample at specific wavelengths. The Alta II makes 11 measurements: blue at 470 nm, cyan at 525 nm, green at 560 nm, yellow at 585 nm, orange at 600 nm, red at 645 nm, deep red at 700 nm, and four infrared readings at 735, 810, 880, and 940 nm. The accuracy of the ALTA II is fair at best with readings ±20 nm. The readings are also compromised because I am using a granular surface instead of a smooth surface. Because of this you can't use the spectrum to actually identify minerals. I actually priced a "budget" spectrometer that would do that, and it came in at $77,000!!! Now I enjoy doing this, but there is a limit. So how can you use these graphs? So far the only thing I've come up with is a relative comparison. That might help you to identify if different samples are actually made from the same materials because they reflect different wavelengths of light in a similar manner. You can't tell what the components are in the various samples, butyou can see how they relate. If you have any thoughts or ideas for use of the spectra, don't hesitate to drop me an e-mail.
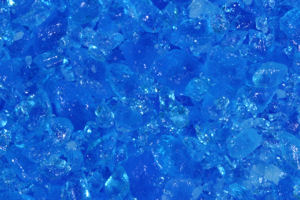
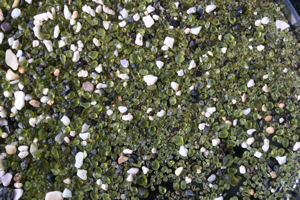
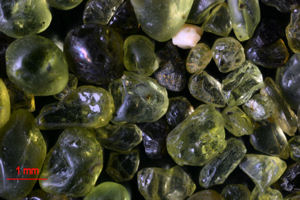
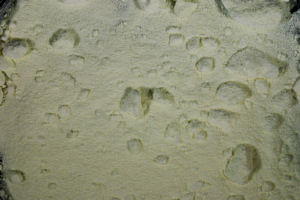
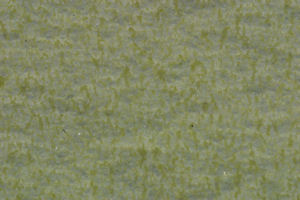
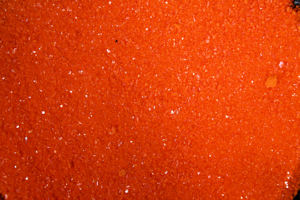
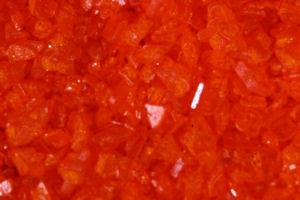
Shown below are samples of sand and other materials that are as pure as I could find in my collection made from one color and their unique reflectance spectrum. I'm looking for yellow, orange and blue sand! Until that time, I've substituted sulfur powder for yellow, and cupric sulfate for blue, and potassium dichromate for orange. As I find better samples I'll change them. This gives you some idea on how a sample made from a relatively pure sample color reflects the different wavelengths.
The plan is to go through all of the samples, and create a spectrum for each. As I complete each state or country I will add it to a list.. Click here to follow my progress.
|
|
|
|
|
|
|
|
|
|
|
|
|
|
|
|
|
|
|
|
|
|
|
|
|
|
|
|
|
|
|
|
|
|
|
|
|
|
|
|
Return to Home